Data Scripting
The purpose of this assignment is to get you comfortable with writing clean and correct programs quickly for basic tasks. The tasks are chosen as the kind you would encounter if you are processing data sets in a data science setting; hence the name. We strongly encourage the use of higher-order functions (in moderation) to both reduce your burden and improve the conciseness and comprehensibility of your code.
For this homework, you are expected to do the work entirely on your own (without help from the course staff, whom you may only consult for help with names of library functions or other essential information of that sort). This is to make sure you are functioning at the level we expect at this point of the course.
Note that some of the problems use special values like 0 or -999 to delimit content. In general, you should not do this in your own programs: use properly structured data rather than embedding the shape in the data. However, sometimes you will confront real-world data sources that do this, and you may not have the freedom to change them. These problems give you a feel for working in such settings.
1 Theme Song
Technologic by Daft Punk
2 Examplar
There is no Examplar support for this assignment. You should just use code.pyret.org. Use a different file for each problem below.
3 Palindrome Detection Modulo Spaces and Capitalization
A palindrome is a string with the same letters in each of forward and reverse order (ignoring capitalization). Design a program called is-palindrome that consumes a string and produces a boolean indicating whether the string with all spaces and punctuation removed is a palindrome. Treat all non-alphanumeric characters (i.e., ones that are not digits or letters) as punctuation. For this problem, we assume the set of alphanumeric characters is letters (a-z and A-Z) and digits (0-9).
is-palindrome("a man, a plan, a canal: Panama") is true
is-palindrome("abca") is false
is-palindrome("yes, he did it") is false
is-palindrome("1221") is true
is-palindrome("01001") is false
4 Sum Over Table
Assume that we represent tables of numbers as lists of rows, where each row is itself a list of numbers. The rows may have different lengths. Design a program sum-largest that consumes a table of numbers and produces the sum of the largest item from each row. Assume that no row is empty.
sum-largest(
[list: [list: 1, 7, 5, 3], [list: 20], [list: 6, 9]])
is (7 + 20 + 9)
5 Adding Machine
Design a program called adding-machine that consumes a list of numbers and produces a list of the sums of each non-empty sublist separated by zeros. Ignore input elements that occur after the first occurrence of two consecutive zeros.
adding-machine([list: 1, 2, 0, 7, 0, 5, 4, 1, 0, 0, 6])
is [list: 3, 7, 10]
6 The BMI Sorter
A personal health record (PHR) contains four pieces of information on a patient: their name, height (in meters), weight (in kilograms), and last recorded heart rate (as beats-per-minute). A doctor’s office maintains a list of the personal health records of all its patients.
data PHR:
| phr(name :: String,
height :: Number,
weight :: Number,
heart-rate :: Number)
end
BMI = weight / (height * height)
fun bmi-report(phrs :: List<PHR>) -> Report
data Report:
| bmi-summary(under :: List<String>,
healthy :: List<String>,
over :: List<String>,
obese :: List<String>)
end
Example:
Given the following input list of PHRs:
[list: phr("eugene", 2, 60, 77),
phr("matty", 1.55, 58.17, 56 ),
phr("ray", 1.8, 55, 84),
phr("mike", 1.5, 100, 64)]
The output of bmi-report should be:
bmi-summary(
[list: "eugene", "ray"], # under
[list: "matty"], # healthy
[list: ], # over
[list: "mike"] # obese
)
7 Data Smoothing
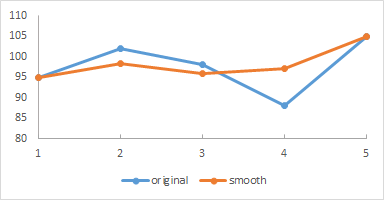
In data analysis, smoothing a data set means approximating it to capture important patterns in the data while eliding noise or other fine-scale structures and phenomena. One simple smoothing technique is to replace each (internal) element of a sequence of values with the average of that element and its predecessor and successor. Assuming that extreme outlier values are an abberation caused, perhaps, through poor measurement, this averaging process replaces them with a more plausible value in the context of that sequence.
For example, consider this sequence of heart-rate values taken from a list of personal health records (defined above):
95 102 98 88 105
The resulting smoothed sequence should be
95 295/3 96 97 105
102 was substituted by 295/3: (95 + 102 + 98) / 3
98 was substituted by 96: (102 + 98 + 88) / 3
88 was substituted by 97: (98 + 88 + 105) / 3
This information can be plotted in a graph such as below, with the smoothed graph superimposed over the original values.
fun data-smooth(phrs :: List<PHR>) -> List<Number>
Example:
As given in the descriptive example above, assuming the initial sequence is instead a list of PHRs with the given values as the heart-rates.
8 Most Frequent Words
fun frequent-words(words :: List<String>) -> List<String>
the input will have at least three different words
all characters are lowercase letters (there will be no numbers, punctuations, or white spaces)
multiple words with the same frequency will have different lengths
Example:
frequent-words(
[list: "silver", "james", "james", "silver",
"howlett", "silver", "loganne", "james", "loganne"])
is [list: "james", "silver", "loganne"]
9 Earthquake Monitoring
Geologists want to monitor a local mountain for potential earthquake activity. They have installed a sensor to track seismic (vibration of the earth) activity. The sensor sends measurements one at a time over the network to a computer at a research lab. The sensor inserts markers among the measurements to indicate the date of the measurement. The sequence of values coming from the sensor looks as follows:
20151004 150 200 175 20151005 0.002 0.03 20151007 130 0.54 20151101 78
The 8-digit numbers are dates (in year-month-day format). For example, the first number 20151004 above is October 4th, 2015.
Numbers in the range (0, 500] are vibration frequencies (in Hz). This example shows readings of 200, 150, and 175 on October 4th, 2015 and readings of 0.002 and 0.03 on October 5th, 2015. There are no data for October 6th (sometimes there are problems with the network, so data go missing).
Assume that the data are in order by dates (so a later date never appears before an earlier one in the sequence) and that all data are from the same year. Also, assume that every date that appears has at least one measurement.
fun daily-max-for-month(sensor-data :: List<Number>, month :: Number) -> List<Report>
data Report:
| max-hz(date :: Number, max-reading :: Number)
end
Example:
Given the following input list (repeated from above):
[list: 20151004, 150, 200, 175, 20151005, 0.002, 0.03,
20151007, 130, 0.54, 20151101, 78]
and the month 10 (for October), the result of daily-max-for-month should be
[list: max-hz(20151004, 200),
max-hz(20151005, 0.03),
max-hz(20151007, 130)]
10 Handing In
Please create seven files in: palindrome.arr, sum.arr, adding.arr, bmi.arr, datasmooth.arr, frequentwords.arr, and earthquake.arr.
Please put the text provide * at the top of each file.